Dashboard Overview
The Lumea Dashboard is a powerful web-based interface that provides a comprehensive view of your AI workflows, agents, and analytics.
What is the Dashboard?
The Dashboard is the central hub for managing and monitoring your Lumea platform. It provides:
- Real-time visibility into workflow performance
- Agent and workflow configuration tools
- Analytics and cost monitoring
- User and team management capabilities
Getting Started
Login Process
To access the Lumea Dashboard, follow these steps:
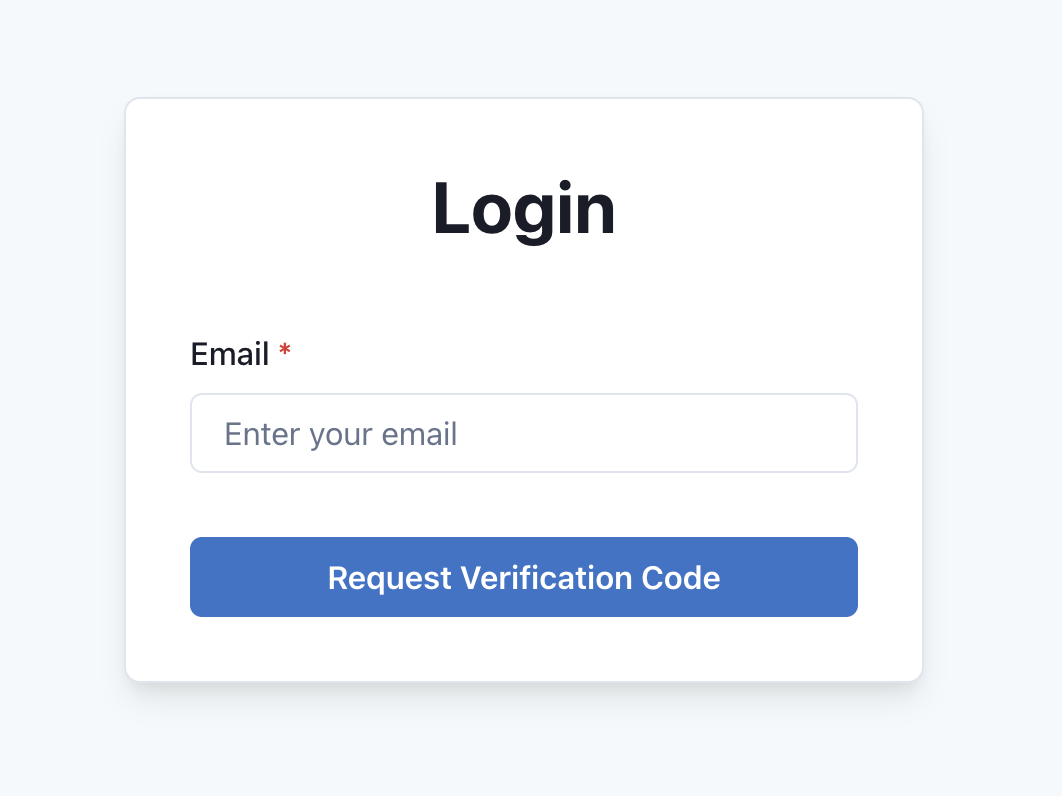
- Navigate to the Lumea Dashboard URL in your web browser
- You'll be presented with the login screen where you need to enter your email address
- After entering your email, you'll receive a verification code
- Enter the verification code on the next screen to complete the login process
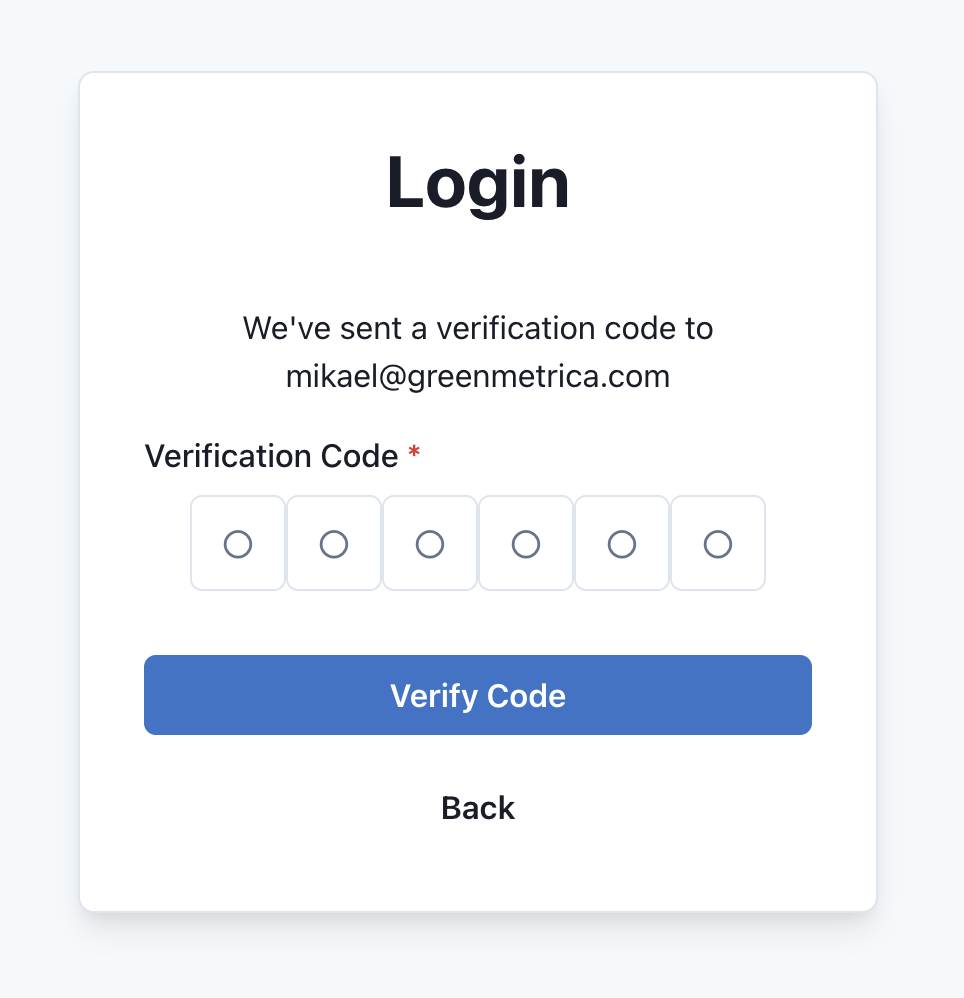
- Upon successful verification, you'll be redirected to the Dashboard home page
For more detailed login instructions, see Dashboard Login.
Dashboard Interface
The Dashboard interface is designed to be intuitive and efficient, providing quick access to all the tools you need:
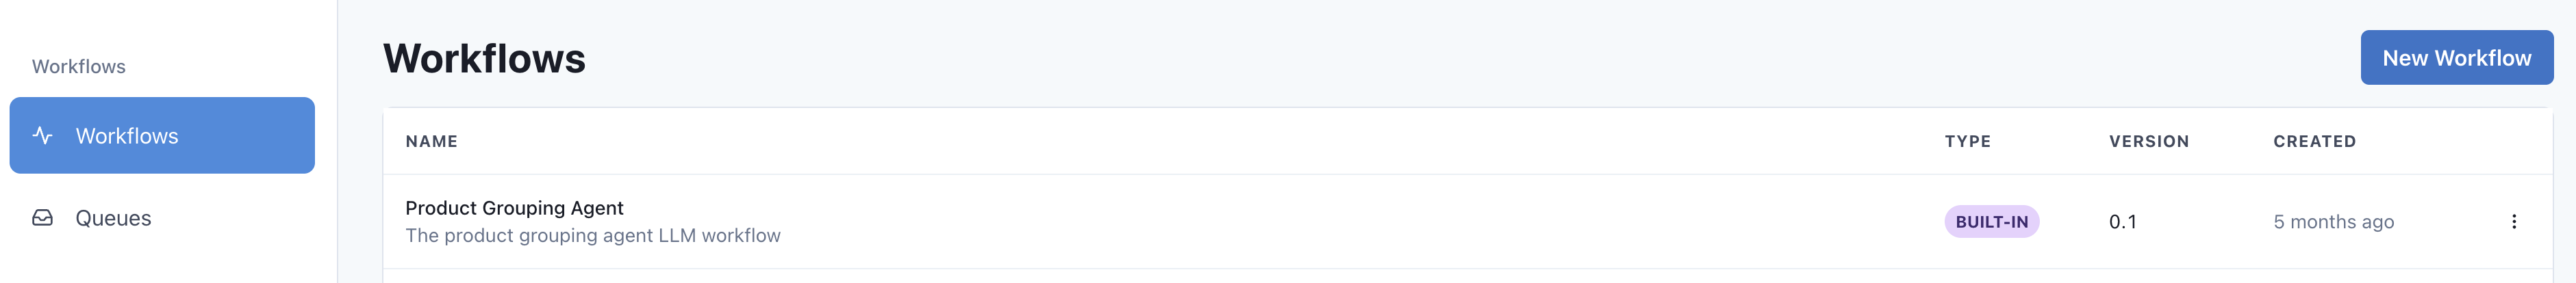
Main Navigation
- Workflows: View and manage all your AI workflows
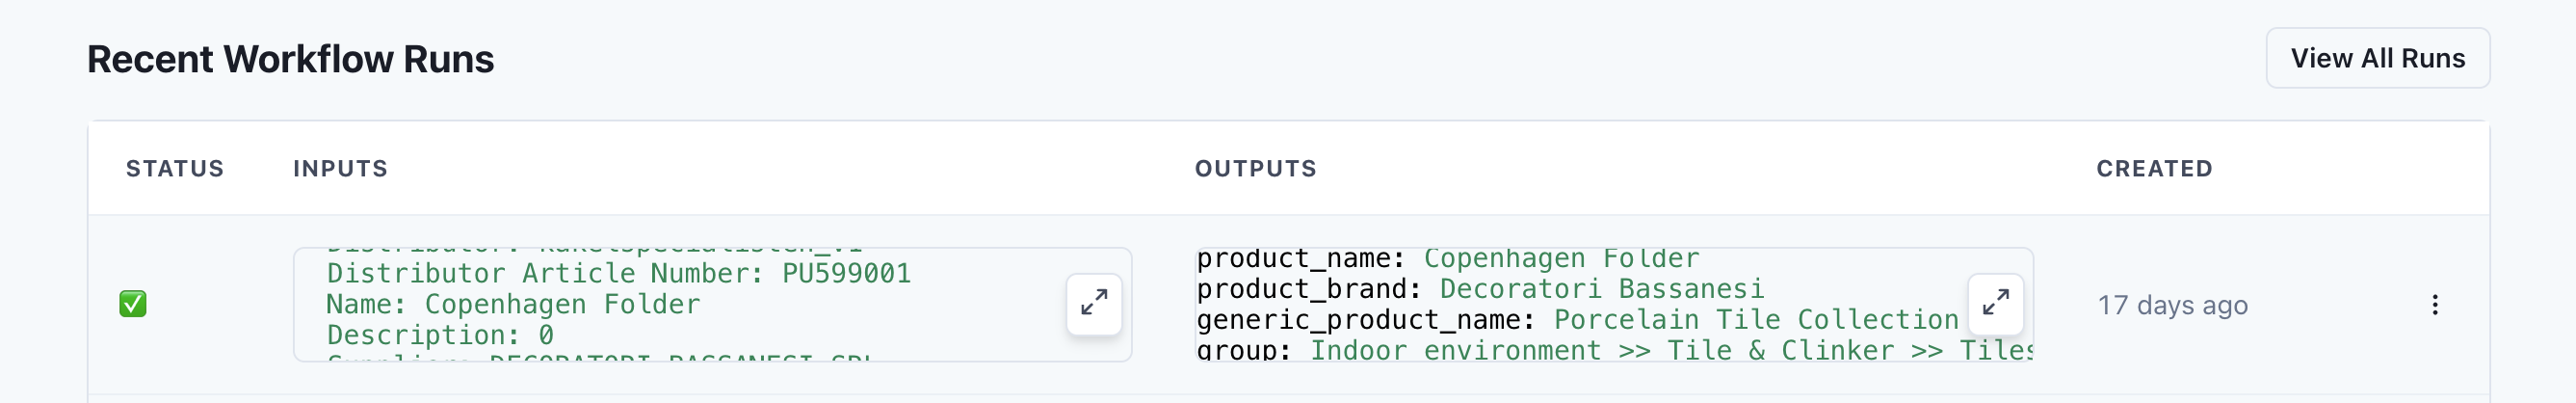
- Recent Runs: See your latest workflow executions and their status
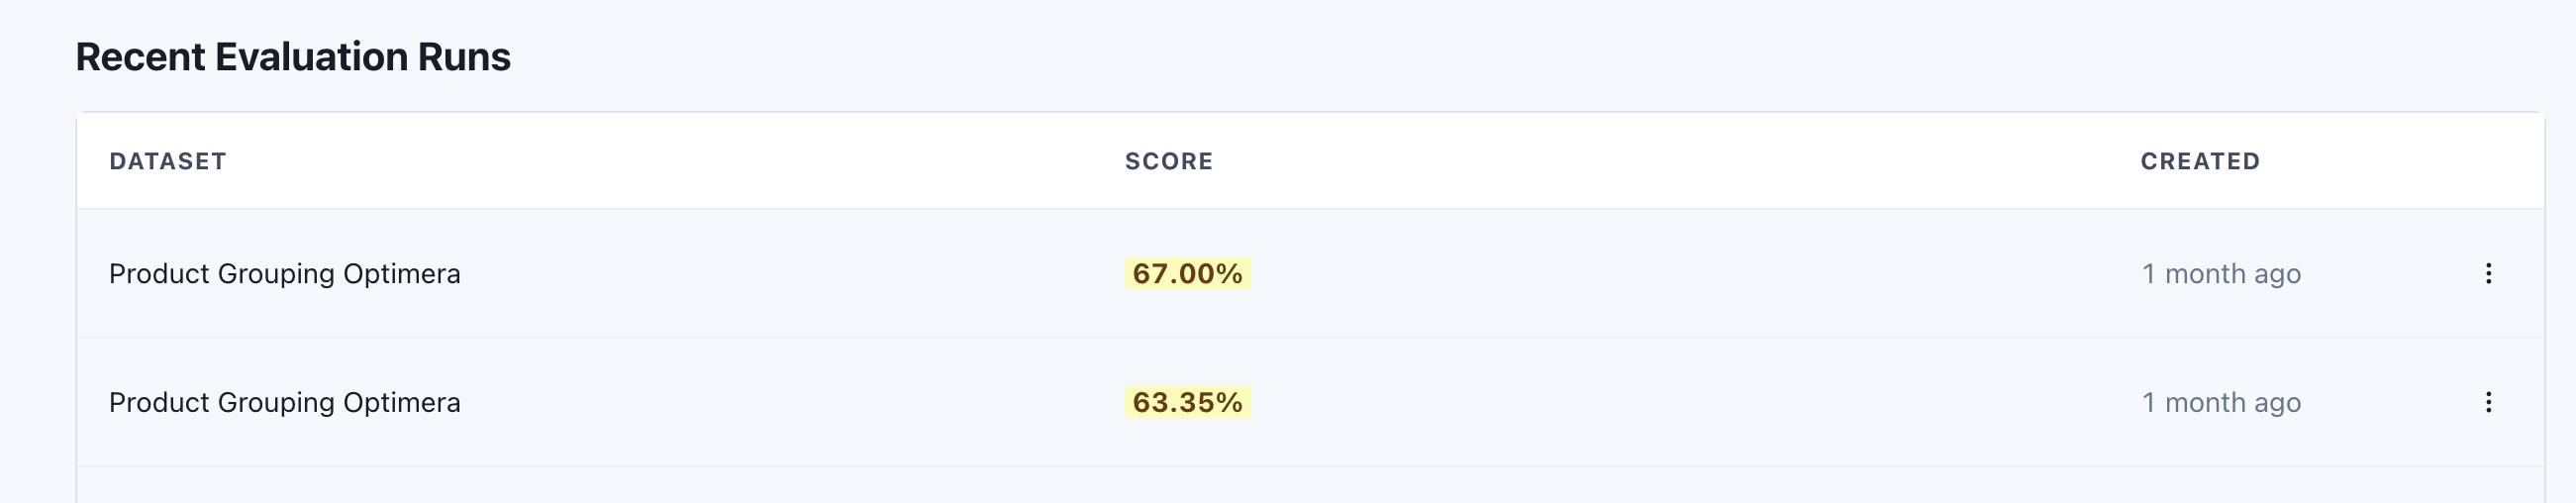
- Evaluation Runs: Monitor the performance of your evaluation metrics
For more information about the workflow list view, see Workflow List.
Workflow Details
When viewing a specific workflow, you can access:
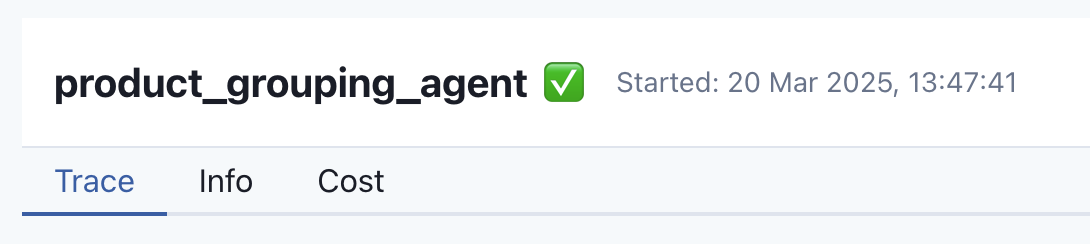
- Workflow Header: Overview of workflow status and key actions
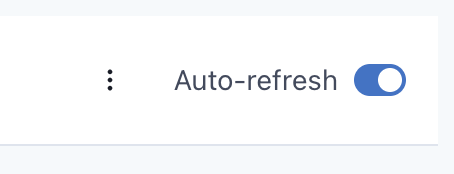
- Logs: Real-time logs with auto-refresh capabilities
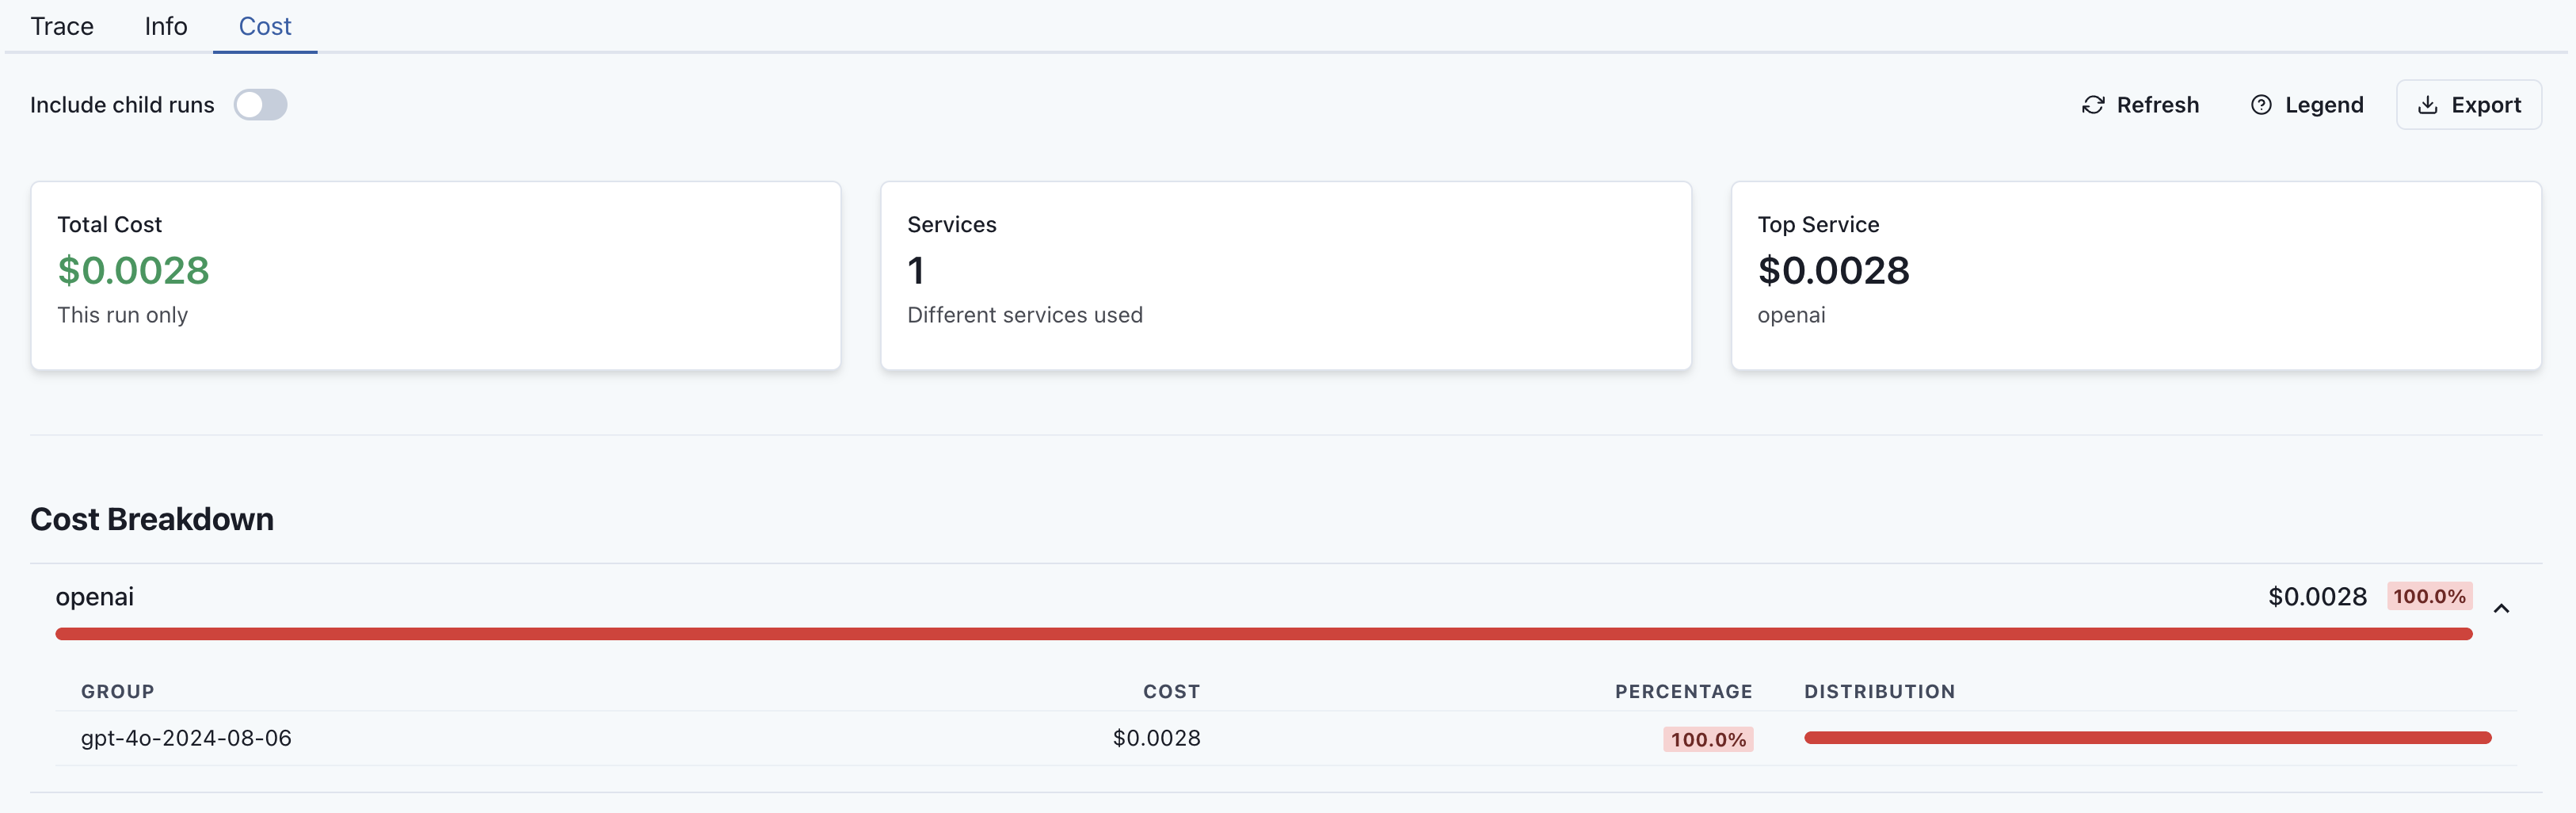
- Cost Analysis: Track usage and costs associated with your workflow
For more detailed information about workflow details, see Workflow Details.
Next Steps
- Dashboard Login - How to access the Dashboard
- Workflows - Working with AI workflows
- Evaluations - Measuring workflow performance
- Connections - Integrating external services
- API Keys - Managing API access
- Organisation - Team and permission management