Workflow Trace
The Workflow Trace provides detailed execution information for individual workflow runs, allowing you to monitor, debug, and optimize your workflows.
Overview
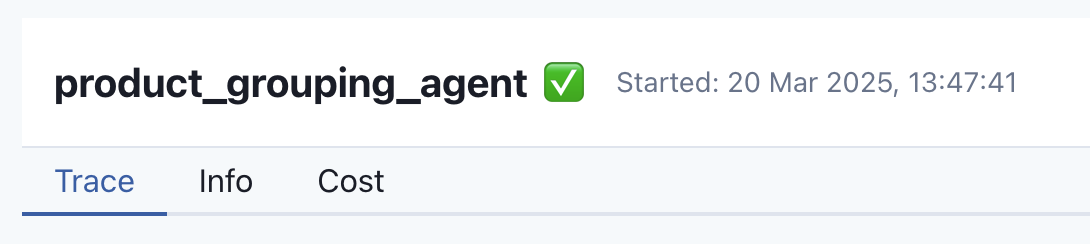
When you select a specific run from the Workflow Details page, you'll be taken to the Workflow Trace view, which gives you comprehensive insights into the execution:
Key Features
Real-time Logs
The Logs section provides detailed information about the workflow execution process:
Key features of the logging system include:
- Real-time log streaming with auto-refresh capability
- Filtering options to focus on specific log levels or components
- Searching functionality to find relevant log entries
- Timestamp information for each log entry
- Ability to export logs for external analysis
Cost Analysis
The Cost tab helps you understand the resource usage and expenses associated with your workflow run:
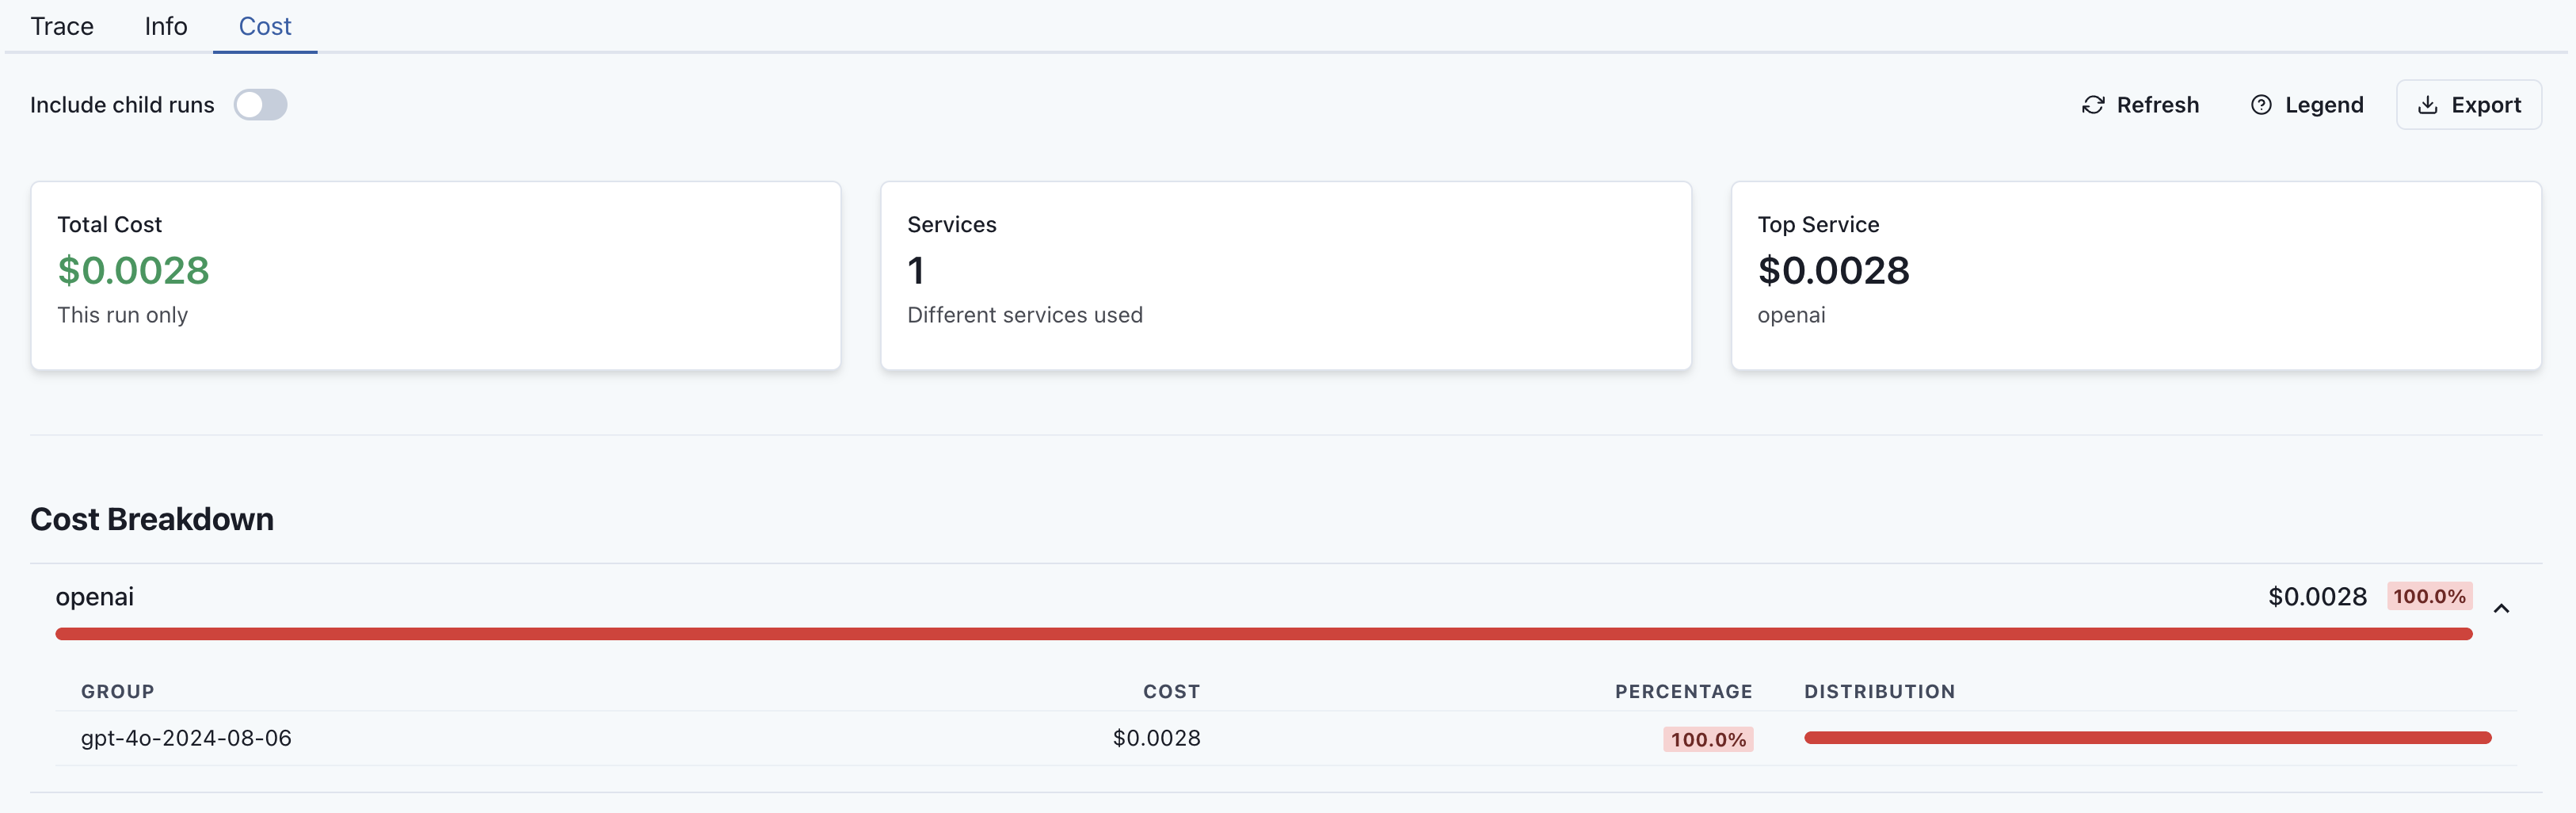
The cost analysis provides:
- Breakdown of costs by component
- Token usage statistics
- Compute time metrics
- Comparison with historical runs
- Cost optimization recommendations
Navigation
From the Workflow Trace view, you can:
- Return to the Workflow Details page
- Navigate to previous or next runs
- Export trace data for offline analysis
- Share the trace with team members
Troubleshooting
The Workflow Trace is your primary tool for debugging issues in your workflows:
- Use the logs to identify error messages and exceptions
- Check component execution times to identify bottlenecks
- Review resource usage to spot inefficiencies
- Compare successful runs with failed runs to identify differences
Next Steps
Related Sections
- Workflow List - Overview of all your workflows
- Workflow Details - Detailed view of individual workflows